
Verified voter files match survey respondents against official state turnout records, offering a more accurate record of presidential coalitions than election-night exit polls. Official election returns and validated voter studies document substantial demographic realignments across the three presidential elections between 2016 and 2024.
Donald Trump won the presidency on November 8, 2016, lost to Joe Biden in 2020, and defeated Kamala Harris on November 5, 2024.
In 2016, Trump won 304 electoral votes while trailing the popular vote by 2.1 points; in 2024, he won 312 electoral votes and the popular vote by 1.5 points.
Validated turnout data shows how racial, educational, generational, religious, and geographic shifts restructured both major parties over those eight years. The eight entries below track the largest measurable demographic changes across the 2016, 2020, and 2024 presidential coalitions.
Evaluating Coalition Dynamics Across Three Consecutive Presidential Cycles
This list tracks eight demographic shifts between the November 8, 2016, November 3, 2020, and November 5, 2024 presidential elections. National vote totals follow certified state returns compiled by the Federal Election Commission.
Subgroup coalition shares and voting margins come from the Pew Research Center validated voter studies for 2016, 2020, and 2024, which verify survey respondents against commercial voter files and state poll records. The table below summarizes all eight metrics across the three cycles.
| Demographic Metric | 2016 Baseline | 2020 Midpoint | 2024 Benchmark | Eight-Year Trajectory |
|---|---|---|---|---|
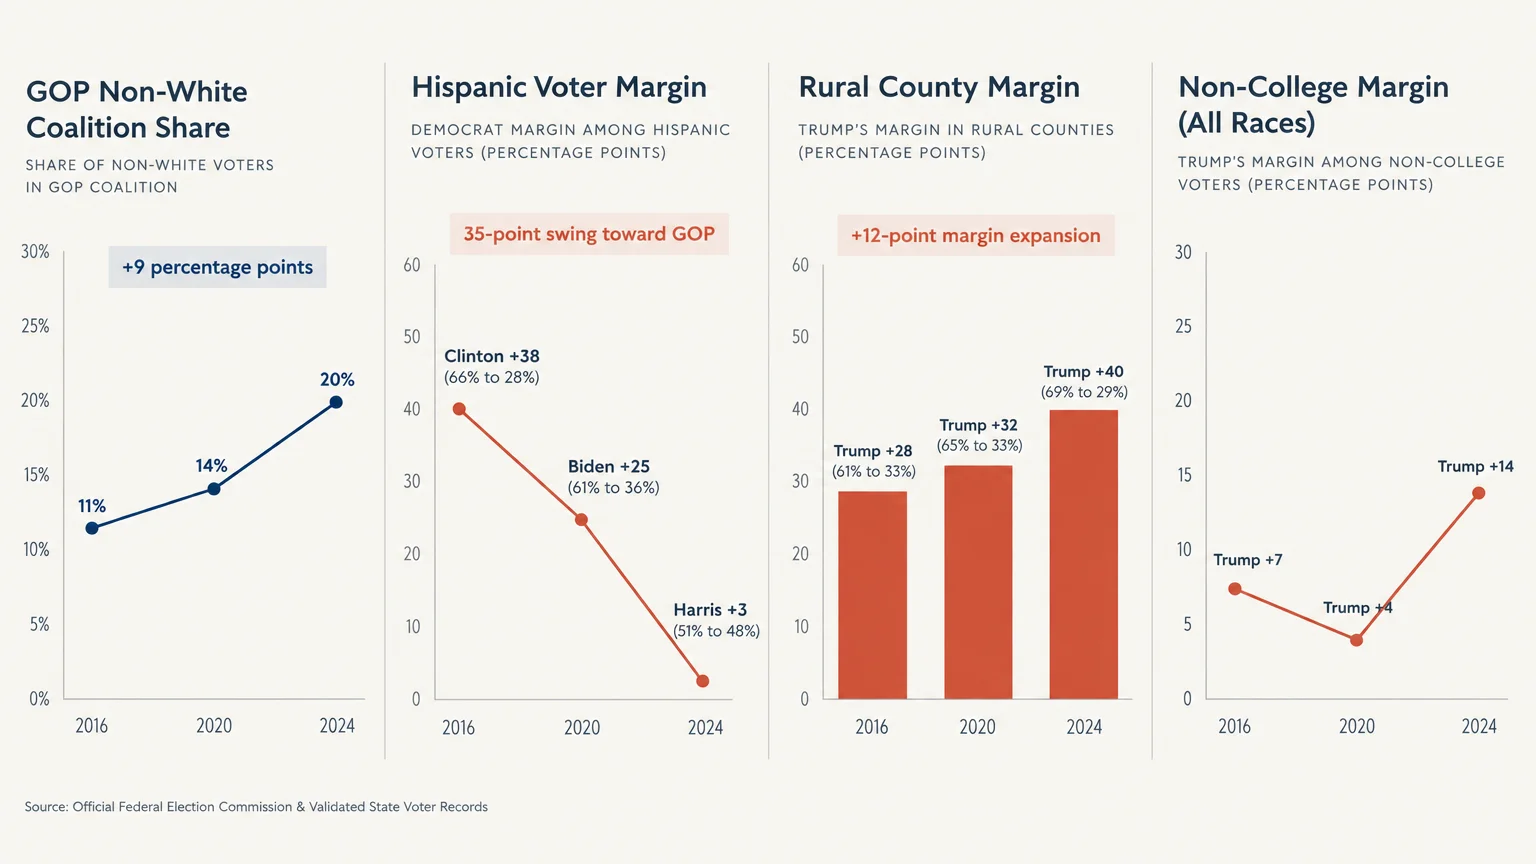
| GOP Non-White Coalition Share | 11% of Trump voters | 14% of Trump voters | 20% of Trump voters | +9 percentage points |
| Democratic White Coalition Share | 60% of Clinton voters | 61% of Biden voters | 64% of Harris voters | +4 percentage points |
| Hispanic Voter Margin | Clinton +38 (66% to 28%) | Biden +25 (61% to 36%) | Harris +3 (51% to 48%) | 35-point swing toward GOP |
| White Non-College GOP Share | 63% of Trump voters | 58% of Trump voters | 51% of Trump voters | -12 percentage points |
| Non-College Margin (All Races) | Trump +7 (50% to 43%) | Trump +4 (50% to 46%) | Trump +14 (56% to 42%) | +7-point margin expansion |
| GOP Coalition Under Age 50 | 35% of Trump voters | 36% of Trump voters | 40% of Trump voters | +5 percentage points |
| White Protestant GOP Share | 52% of Trump voters | 51% of Trump voters | 43% of Trump voters | -9 percentage points |
| Rural County Margin | Trump +28 (61% to 33%) | Trump +32 (65% to 33%) | Trump +40 (69% to 29%) | +12-point margin expansion |
1. Racial and Ethnic Diversification of the Republican Base
The Republican presidential coalition grew substantially more diverse between the 2016 and 2024 general elections. Non-White voters steadily expanded their share of the party’s presidential vote across all three cycles.
On November 8, 2016, non-White voters—including Hispanic, Black, Asian, and other minority citizens—accounted for 11 percent of Donald Trump’s total coalition. By November 5, 2024, that collective demographic share rose to 20 percent.
Conversely, the non-Hispanic White proportion of the Republican base declined over the same eight-year span. White voters made up 88 percent of Trump’s coalition in 2016, 86 percent in 2020, and 78 percent in 2024.
Certified state returns recorded in the National Archives Electoral College Records show that these shifts coincided with Trump flipping Nevada in 2024 and expanding his winning margin in Florida to 13.1 percentage points.
2. Increasing White Proportion Within the Democratic Coalition
While the Republican coalition added non-White voters, the Democratic coalition grew measurably more White across the same period. Pew Research Center’s validated voter records document a four-point increase in the White share of Democratic presidential voters from 2016 to 2024.
Non-Hispanic White voters made up 60 percent of Hillary Clinton’s coalition in 2016. That proportion rose to 61 percent for Joe Biden in 2020 and reached 64 percent for Kamala Harris in November 2024.
This internal shift occurred even as non-Hispanic White citizens declined as a percentage of the total national electorate. Data from the U.S. Census Bureau Voting Supplement and Pew validated voter files shows White voters declined from 74 percent of the electorate in 2016 to 71 percent in 2024.
Because minority voters shifted toward the Republican column while White college-educated voters moved toward Democrats, White voters accounted for nearly two-thirds of all ballots cast for Harris in 2024.
3. Hispanic Voter Realignment Toward Parity
Hispanic voters recorded the largest partisan shift of any major racial or ethnic group between the 2016 and 2024 elections. Validated voter studies track a 35-point net margin swing toward the Republican ticket over eight years.
In 2016, Hillary Clinton won 66 percent of validated Hispanic voters compared to Donald Trump’s 28 percent, a 38-point margin. Joe Biden carried Hispanic voters by a reduced 25-point margin in 2020, winning 61 percent to Trump’s 36 percent.
By November 5, 2024, the national Hispanic vote narrowed to near parity. Kamala Harris carried Hispanic voters by three percentage points, winning 51 percent to Donald Trump’s 48 percent.
As a result of both population growth and higher Republican support, Hispanic citizens rose from 6 percent of Trump’s coalition in 2016 to 10 percent in 2024.
4. Declining Numerical Dominance of White Non-College Voters in the GOP Base
Non-college White voters remained the single largest voting bloc in the Republican Party throughout the 2016–2024 period, but their proportional share of the Republican coalition fell by 12 percentage points.
In the November 2016 election, White voters without a four-year college degree cast 63 percent of all ballots for Donald Trump. That share dropped to 58 percent in the November 3, 2020 presidential contest.
By November 2024, their share of Trump’s total vote narrowed to 51 percent. Non-college White voters backed Trump over Harris by 66 percent to 32 percent, matching their 65 percent to 33 percent split in 2020.
Because non-college White support rates held steady, their smaller proportional share of the overall 2024 Republican coalition resulted from larger inflows of college-educated and non-White voters into Trump’s column.
5. Deepening of the Educational Attainment Divide Across All Races
Educational attainment widened as a partisan dividing line across every racial group between the 2016 and 2024 presidential campaigns. Voters without a four-year college degree shifted further toward the Republican ticket, while college graduates consolidated behind Democrats.
Donald Trump won non-college voters of all races by seven percentage points in 2016, defeating Hillary Clinton 50 percent to 43 percent. In November 2024, Trump doubled that margin to 14 percentage points, winning 56 percent to 42 percent.
At the same time, college-educated voters grew as a share of the Democratic base. Voters holding at least a four-year degree rose from 43 percent of Hillary Clinton’s coalition in 2016 to 48 percent of Kamala Harris’s coalition in 2024.
Kamala Harris carried college graduates nationwide by 57 percent to 41 percent in 2024, while campaign finance disclosures in the Federal Election Commission Receipts Database show suburban zip codes with high shares of degree holders leading itemized individual donor totals.
6. Generational Realignment Toward Younger Voters in the Republican Base
Validated voter files show that the Republican presidential coalition grew younger between 2016 and 2024, while the age profile of the Democratic coalition remained unchanged.
Voters under age 50 made up 35 percent of Donald Trump’s total coalition in the November 2016 election and 36 percent in 2020. By November 5, 2024, voters under 50 accounted for 40 percent of Trump’s overall support.
Meanwhile, the Democratic age distribution held flat across the eight-year span. Voters under age 50 represented 48 percent of Hillary Clinton’s voters in 2016 and 48 percent of Kamala Harris’s voters in 2024.
Gains among younger men drove much of the Republican shift: after losing men under 50 by 10 percentage points in 2020 (53 percent to 43 percent), Trump split men under 50 evenly with Harris in 2024 (49 percent to 48 percent).
7. Shrinking Share of White Protestants Within the Conservative Base
White Protestants formed an absolute majority of Republican presidential coalitions in both 2016 and 2020, but fell below 50 percent of the Republican base in the 2024 general election.
In 2016, White Protestants—combining evangelical and mainline denominations—made up 52 percent of all Donald Trump voters, and held at 51 percent in 2020. By November 2024, their combined share dropped to 43 percent of his coalition.
Within that 2024 total, White evangelical Protestants accounted for 29 percent of Trump’s voters (winning 82 percent of their vote), while White mainline Protestants accounted for 15 percent.
Over the same period, Hispanic Catholics and non-White Protestants grew to 9 percent of Trump’s total coalition in 2024, offsetting the smaller proportional share of White Protestants.
8. Rural Margin Expansion and the Turnout Participation Flip
Geographic divergence between rural and urban voters widened in each presidential election from 2016 to 2024, accompanied by a reversal in the partisan lean of infrequent voters.
Donald Trump won rural voters by 28 percentage points in 2016 (61 percent to 33 percent) and by 32 points in 2020 (65 percent to 33 percent). In 2024, Trump carried rural voters by 40 percentage points, winning 69 percent to Kamala Harris’s 29 percent.
Simultaneously, irregular and newly eligible voters flipped toward the Republican ticket. In 2016 and 2020, eligible citizens who had skipped the prior presidential election favored Democrats or split evenly, whereas in 2024, 2020 non-voters who turned out backed Trump 54 percent to 42 percent.
Among Hispanic voters who did not vote in 2020 but cast ballots in 2024, Trump won 60 percent to 37 percent, contributing to the national vote totals recorded by the American Presidency Project.
How Coalition Restructuring Reshapes Modern Electoral Strategy
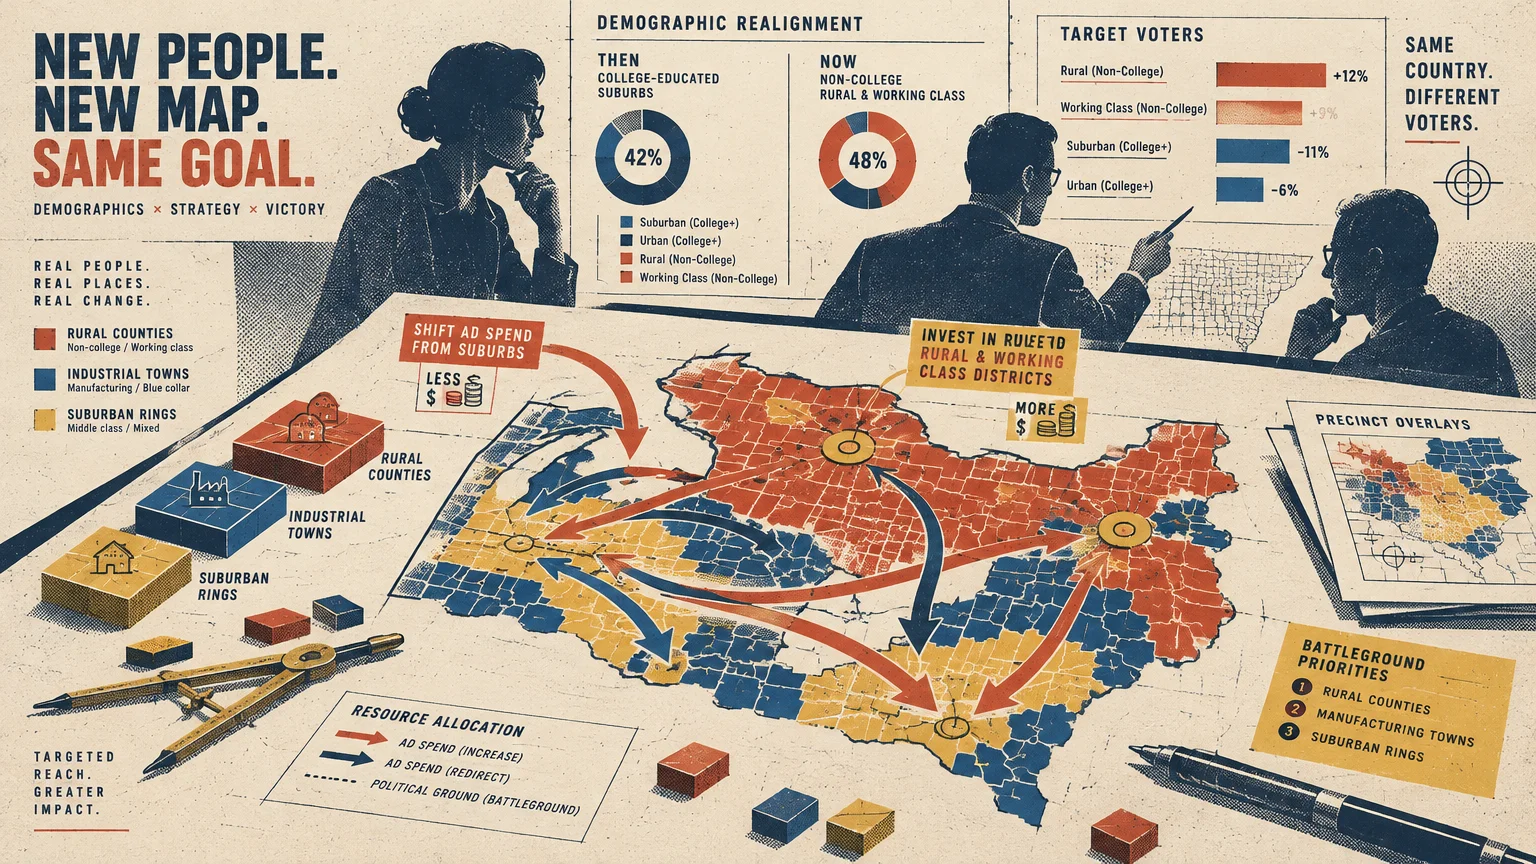
The demographic shifts between 2016 and 2024 show educational attainment and urban-rural geography cutting across historical racial voting patterns. Neither major party retained the exact coalition structure it held eight years earlier.
In 2024, Donald Trump assembled a coalition in which non-college White voters represented 51 percent of his total vote and non-White voters represented 20 percent.
Those gains among non-White and irregular voters allowed him to carry all seven battleground states—Arizona, Georgia, Michigan, Nevada, North Carolina, Pennsylvania, and Wisconsin.
Concurrently, the Democratic Party increased its support among college-educated suburban voters, with non-Hispanic White voters composing 64 percent of Kamala Harris’s 2024 coalition and four-year degree holders composing 48 percent.
Because rural voters backed Trump by a 40-point margin (69 percent to 29 percent) and urban voters backed Harris by a 27-point margin (62 percent to 35 percent), geographic polarization remained a central feature of the 2024 presidential map.
Frequently Asked Questions About Coalition Demographic Shifts
Why do validated voter studies provide more reliable data than exit polls?
Election-night exit polls rely on in-person precinct samples and telephone or online surveys of early voters that are subject to non-response bias. Early estimates often require post-election weighting adjustments once counties certify final vote tallies.
Validated voter studies match survey participants directly against official state voting records after election certification. Researchers verify whether each respondent cast a ballot in the November general election before calculating subgroup percentages.
Did Hispanic men drive the Republican movement among Hispanic voters?
Hispanic men backed Donald Trump at higher rates than Hispanic women, splitting 50 percent for Trump to 49 percent for Harris in 2024, while Hispanic women favored Harris 52 percent to 46 percent.
Combined, Kamala Harris led Hispanic voters overall by three percentage points (51 percent to 48 percent) in 2024, down from Hillary Clinton’s 38-point margin (66 percent to 28 percent) in 2016.
How did the education divide change suburban congressional voting?
Suburban voters overall split 51 percent for Trump to 47 percent for Harris in 2024, but voting inside suburbs divided sharply along educational lines.
Voters holding four-year bachelor’s degrees rose from 43 percent of Clinton’s coalition in 2016 to 48 percent of Harris’s coalition in 2024.
Meanwhile, voters without a college degree backed Trump by 56 percent to 42 percent nationwide in 2024, doubling his seven-point non-college margin from 2016.
What factors caused the Republican coalition to become younger by 2024?
Gains among voters under age 50—particularly men under 50 and younger non-White voters—expanded the under-50 share of Trump’s coalition from 35 percent in 2016 to 40 percent in 2024.
Trump split men under 50 evenly with Harris (49 percent to 48 percent) in 2024 after trailing Biden by 10 points in that group in 2020.
Over the same period, the share of Democratic presidential voters under age 50 remained unchanged at 48 percent in both 2016 and 2024.