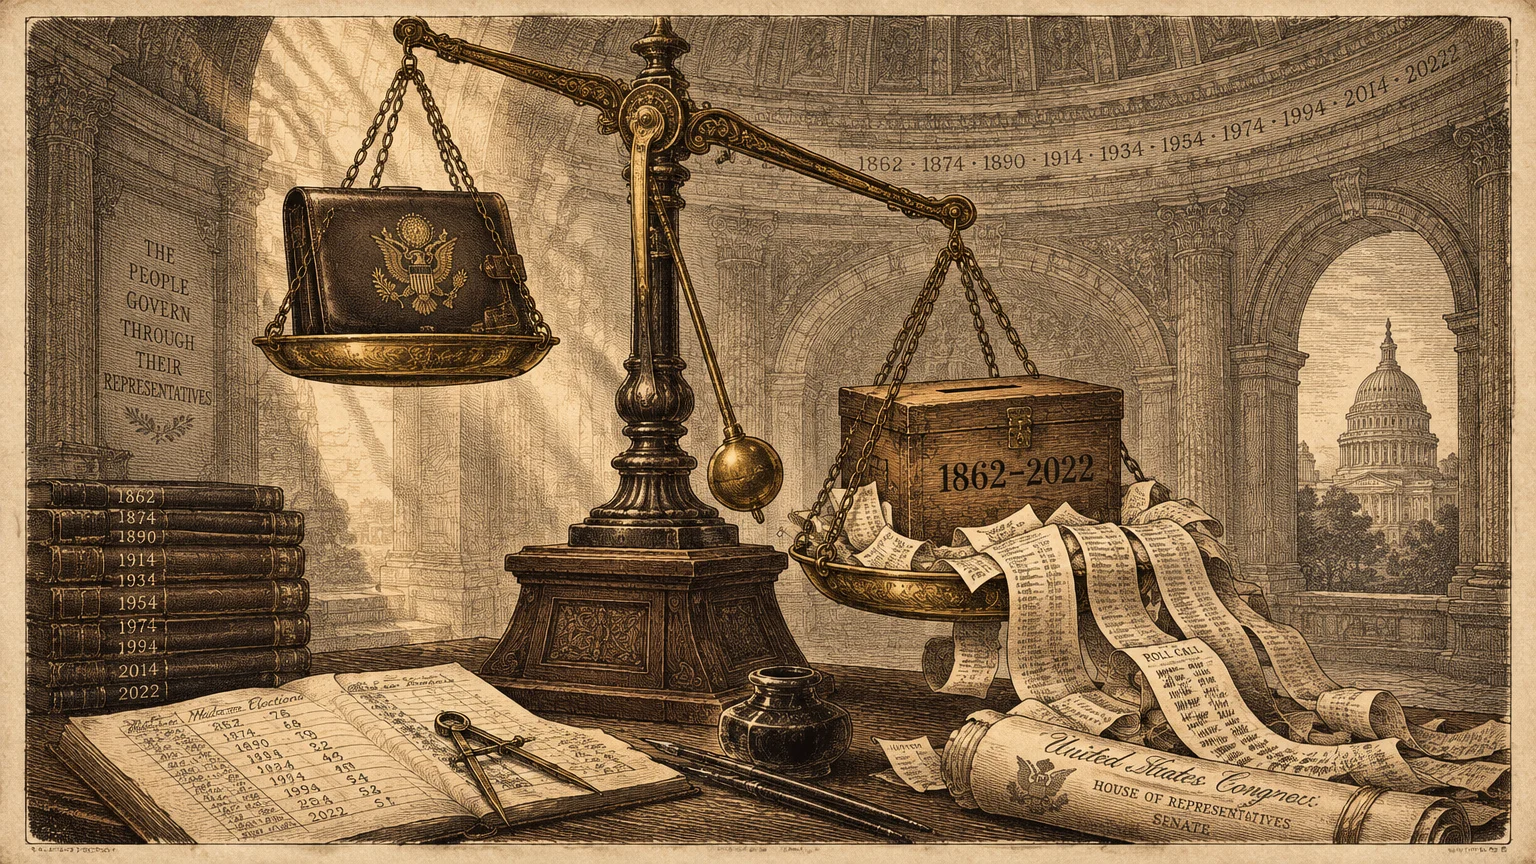
Midterm elections consistently strip the president’s political party of congressional power. This pattern spans sixteen decades of American ballots, from Abraham Lincoln’s wartime struggles to modern divided government.
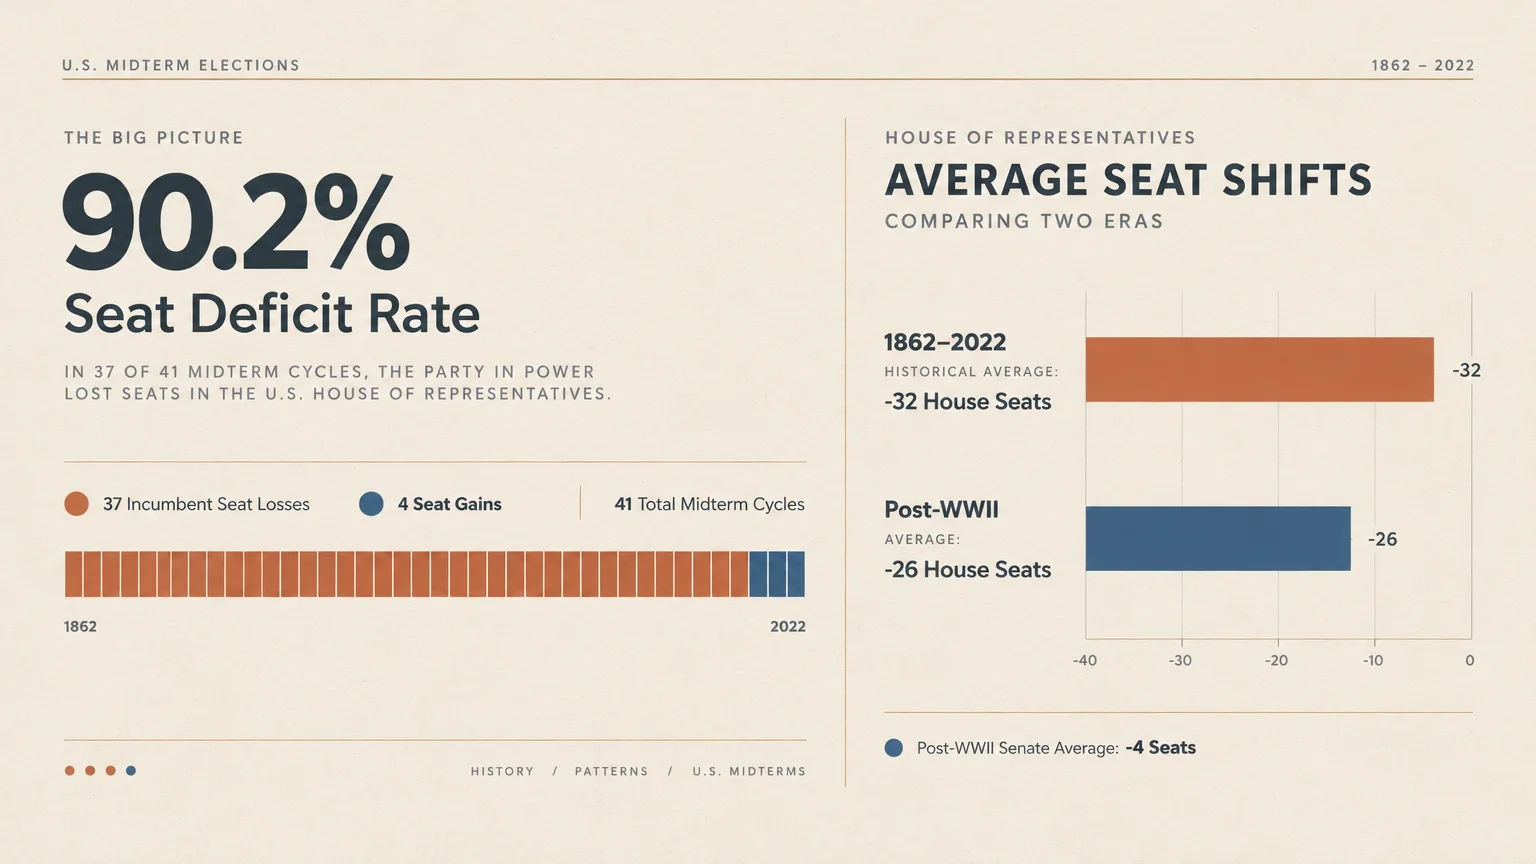
Between 1862 and 2022, the occupant of the White House lost seats in the House of Representatives in 37 out of 41 midterms. These regular reversals show how constitutional design and voter drop-off reshape Congress every four years.
Analyzing Congressional Swings and Electoral Shifts
This list covers all 41 congressional midterm cycles conducted between 1862 and 2022, excluding special elections to focus on national off-year general elections. Seat shifts rely on official counts from the Office of the Clerk of the U.S. House.
The ten entries highlight documented shifts in voter behavior, institutional design, and party control across multiple eras. Demographic and turnout comparisons draw on historical surveys from the U.S. Census Bureau and Pew Research Center.
The Incumbent Party Seat Deficit
Since 1862, the president’s party has surrendered seats in the House of Representatives in 37 of 41 midterm contests. That loss rate exceeds 90 percent across sixteen decades of congressional voting.
Across that entire 1862–2022 span, the White House party surrendered an average of 32 House seats and between two and three Senate seats per midterm. In the post-World War II era, the House loss averaged 26 seats.
Political scientists track this baseline through Congressional Research Service data on national party swings. Voters routinely use the midterm ballot to balance presidential policy against legislative priorities.
The Wartime Fractures of 1862
President Abraham Lincoln faced the first modern midterm test during the Civil War in the autumn of 1862. Northern voters rebuked his administration’s wartime management and early emancipation policies.
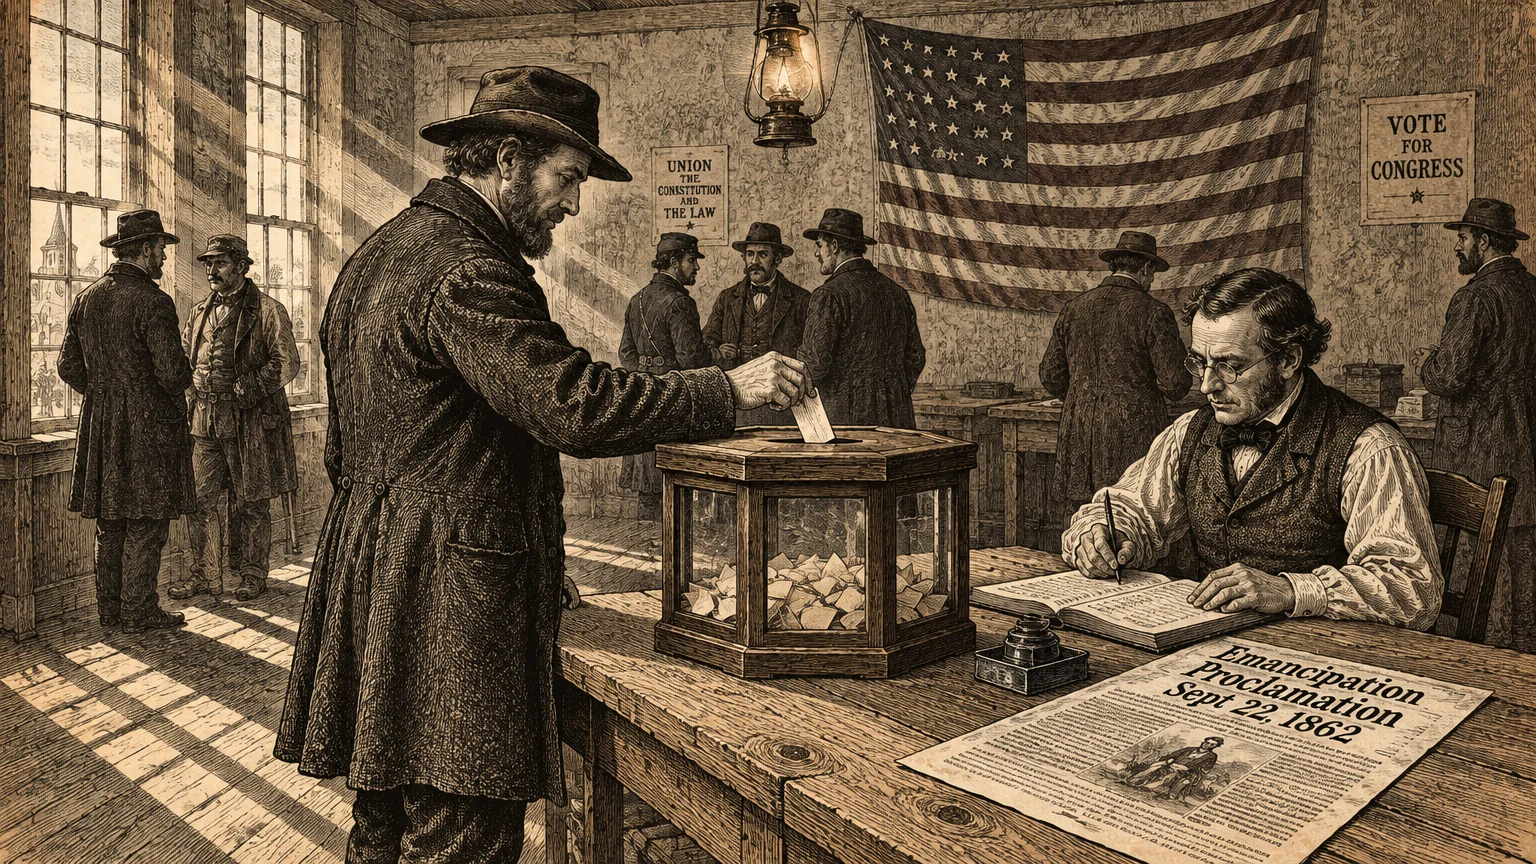
Lincoln issued the preliminary Emancipation Proclamation on September 22, 1862, just weeks before balloting began. Conservative voters in northern states reacted by shifting congressional seats to the Democratic Party.
Official returns in the House Journal recorded Republican candidates shedding between 21 and 23 House seats. Incumbent House Speaker Galusha Grow of Pennsylvania lost re-election in Pennsylvania’s 14th Congressional District on October 14, 1862.
Democrats captured governorships in New York and New Jersey while winning state legislative majorities. Lincoln maintained working control of the 38th Congress by building a coalition with border-state Unionists while expanding his Senate majority.
The Three Expansion Exceptions
Across 160 years, the president’s party expanded its House seat total in only three midterm elections. Franklin D.
Roosevelt, Bill Clinton, and George W. Bush achieved these gains under extraordinary economic or political circumstances.
On November 6, 1934, Roosevelt’s Democrats added nine House seats and nine Senate seats, expanding their majorities in the 74th Congress to over two-thirds of both chambers. Voters backed sweeping administrative action taken under early New Deal recovery statutes.
On November 3, 1998, Clinton’s Democrats picked up five House seats while breaking even in the Senate. Voters reacted against the House Judiciary Committee’s impeachment inquiry authorized by House Resolution 581.
On November 5, 2002, Bush’s Republicans gained eight House seats and two Senate seats after Public Law 107-40 authorized force following the September 11 attacks. Historical seat changes are compiled at The American Presidency Project.
The Reapportionment Distortion of 1902
Historical election summaries occasionally list the 1902 midterms under President Theodore Roosevelt as an incumbent party gain. Statutory records show that this apparent pickup was a product of chamber expansion.
The Apportionment Act of 1901 (31 Stat. 733) added 29 congressional districts, enlarging the House of Representatives from 357 to 386 seats.
This statutory expansion took effect for the 58th Congress elected in November 1902.
While Roosevelt’s Republicans added nine raw seats, the opposition Democratic Party captured 25 of the newly created districts. Consequently, the Republican majority share fell by 2.4 percentage points, from 55.2 percent to 52.8 percent of the chamber.
Economic Panic Waves of the Late Nineteenth Century
The largest midterm collapses in American history occurred during late nineteenth-century financial contractions. Industrial panics wiped out governing coalitions across entire regions.
On November 3, 1874, following the Panic of 1873, President Ulysses S. Grant’s Republicans forfeited 96 House seats.
That crash ended unified Republican control of Congress and stalled Reconstruction legislation.
On November 4, 1890, President Benjamin Harrison’s Republicans lost between 85 and 93 seats after passing the McKinley Tariff Act of 1890 (26 Stat. 567).
Consumers penalized the governing party for abrupt domestic price increases.
On November 6, 1894, President Grover Cleveland’s Democrats lost between 116 and 125 House seats following the Panic of 1893. That reversal remains the largest single-party seat reduction in American congressional history.
Modern Postwar Wave Swings
Postwar political volatility produced steep legislative reversals whenever public frustration converged on White House policy. Harry Truman, Bill Clinton, and Barack Obama all absorbed major midterm losses during their opening terms.
On November 5, 1946, President Truman’s Democrats surrendered 55 House seats amid postwar inflation, labor strikes, and consumer meat shortages. The election seated the Republican 80th Congress, which enacted the Taft-Hartley Act over Truman’s veto.
On November 8, 1994, Representative Newt Gingrich organized the “Contract with America,” propelling Republicans to a 54-seat pickup that ended 40 years of Democratic House control. The wave unseated Democratic House Speaker Tom Foley in Washington’s 5th Congressional District.
On November 2, 2010, President Obama’s party lost 63 House seats and six Senate seats following economic distress and battles over the Affordable Care Act (Public Law 111-148). That shift set the modern record for postwar midterm seat losses.
The Second-Term Six-Year Itch
Political strategist Kevin Phillips coined the phrase “six-year itch” in 1973 to describe voter fatigue during two-term presidencies. Historical election data shows that this fatigue consistently penalizes presidents in their sixth year in office.
Second-term House collapses struck Franklin Roosevelt in 1938 with 72 lost seats and Dwight Eisenhower in 1958 with 48 lost seats. Voters also removed 47 Democrats under Lyndon Johnson in 1966 and 30 Republicans under George W.
Bush in 2006.
This second-term penalty falls heavily on the Senate. Since 1946, second-term midterms have produced an average net loss of six Senate seats, compared to two seats in first-term midterms.
Historical Senate party rosters are maintained by the Senate Historical Office. Senators elected on presidential coattails six years earlier frequently face hostile electoral conditions when defending their seats.
The Fifty-Percent Approval Threshold
Public job approval ratings serve as a reliable indicator of midterm seat losses for an incumbent administration. The historical record shows a clear dividing line around the 50 percent Gallup approval threshold.
When a post-World War II president’s approval rating sits below 50 percent, their party loses an average of 36 House seats. Barack Obama registered a 45 percent approval rating in November 2010 before losing 63 House seats.
Presidents who maintain approval ratings above 50 percent limit their party’s midterm House losses to an average of 12 to 14 seats. Bill Clinton held a 66 percent approval rating in November 1998, when his party gained five House seats.
The Bicameral Split After Direct Senate Elections
Prior to the ratification of the Seventeenth Amendment in 1913, state legislatures chose U.S. senators. The National Archives documents how direct popular election transformed Senate accountability starting with the 1914 midterms.
Because the Senate contests only one-third of its seats every two years, midterm results between the two chambers frequently diverge. Staggered six-year terms prevent national electoral tides from sweeping across both bodies equally.
In 1962, 1970, 2018, and 2022, the president’s party gained Senate seats even while surrendering House territory. President Donald Trump’s Republicans lost 41 House seats in 2018 but gained two Senate seats.
In 2022, President Joe Biden’s Democrats lost nine House seats while gaining one seat in the Senate, expanding their upper-chamber majority to 51 seats.
The Historic Turnout Gap and Modern Surges
Midterm election participation historically lags presidential election turnout by 15 to 20 percentage points. During the late twentieth century, midterm turnout averaged roughly 40 percent of eligible voters.
Survey reports from the U.S. Census Bureau Current Population Survey show that occasional voters routinely skip off-year ballots. This drop-off magnifies the influence of regular voters seeking legislative checks on the executive.
That participation deficit narrowed during the 2018 midterms, when voting-eligible turnout reached 49.4 percent and surpassed 100 million total ballots for the first time. Turnout among voters aged 18 to 29 increased by 79 percent between 2014 and 2018.
High engagement persisted in 2022, reaching 46.8 percent turnout, the second-highest midterm rate since 1914.
| Election Year | President | House Shift | Senate Shift | Primary Historical Driver |
|---|---|---|---|---|
| 1862 | Abraham Lincoln | -21 seats | +5 seats | Civil War policy and Emancipation |
| 1874 | Ulysses S. Grant | -96 seats | -10 seats | Panic of 1873 and Reconstruction |
| 1890 | Benjamin Harrison | -93 seats | -4 seats | McKinley Tariff consumer inflation |
| 1894 | Grover Cleveland | -125 seats | -5 seats | Panic of 1893 economic collapse |
| 1902 | Theodore Roosevelt | +9 seats | 0 seats | Statutory reapportionment expansion |
| 1934 | Franklin D. Roosevelt | +9 seats | +9 seats | Early New Deal economic recovery |
| 1946 | Harry S. Truman | -55 seats | -12 seats | Postwar inflation and labor strikes |
| 1994 | Bill Clinton | -54 seats | -8 seats | Contract with America mobilization |
| 1998 | Bill Clinton | +5 seats | 0 seats | Public backlash against impeachment |
| 2002 | George W. Bush | +8 seats | +2 seats | Post-September 11 national unity |
| 2010 | Barack Obama | -63 seats | -6 seats | Great Recession and healthcare law |
| 2018 | Donald Trump | -41 seats | +2 seats | Surging turnout and chamber split |
| 2022 | Joe Biden | -9 seats | +1 seats | Partisan polarization and narrow swing |
Institutional Mechanics Behind Midterm Swings
The recurring midterm penalty reflects the constitutional structure designed by the Framers in 1787. By establishing staggered two-year House terms and six-year Senate terms, the Constitution prevents temporary majorities from consolidating unchecked national authority.
Political scientists describe this behavior as the balancing theory of voting. Moderate and independent voters routinely cast ballots against the president’s party to prevent either side from dominating both elected branches.
A common political misconception assumes that a massive midterm defeat dooms a president’s re-election chances. Historical election returns contradict this assumption across multiple eras.
Woodrow Wilson lost 61 House seats in 1914, Harry Truman lost 55 in 1946, and Ronald Reagan lost 26 in 1982. All three presidents won second terms two years later.
Bill Clinton lost 54 seats in 1994, and Barack Obama lost 63 seats in 2010 before each won re-election decisively. Midterm reversals often force presidents to moderate policy and negotiate bipartisan legislation.
In the 2020s, intense partisan polarization and diminished ticket-splitting narrowed overall swing sizes. President Biden’s party lost nine House seats in 2022, one of the smallest first-term midterm losses in modern history.
Frequently Asked Questions About Midterm Elections
Why does the president’s party almost always lose seats in midterm elections?
Voters use midterms to check executive power and register disapproval of the administration’s policies. Independent and moderate voters consistently tilt toward opposition candidates to restore legislative balance.
Additionally, presidential supporters often suffer an enthusiasm deficit after winning the executive branch. Meanwhile, the opposition party experiences heightened motivation to turn out and challenge the White House agenda.
Does a severe midterm defeat prevent a president from winning re-election?
History shows that severe midterm defeats do not prevent presidents from winning second terms. Abraham Lincoln, Woodrow Wilson, Harry Truman, Ronald Reagan, Bill Clinton, and Barack Obama all overcame midterm wave losses to win re-election.
Losing congressional majorities often forces the executive branch to recalibrate its legislative goals. Presidents frequently use divided government to strike bipartisan deals before their next national campaign.
How did the Seventeenth Amendment change midterm Senate results?
Ratified on April 8, 1913, the Seventeenth Amendment transferred the selection of U.S. senators from state legislatures directly to voters. The 1914 midterms marked the first direct Senate elections nationwide.
Because only one-third of the Senate is elected every two years, the Senate map often diverges from national House trends. This structural difference allowed the president’s party to gain Senate seats in 1962, 1970, 2018, and 2022.
Why did midterm voter turnout spike in 2018 and 2022?
Deep partisan polarization elevated the perceived stakes of congressional control for regular voters. Expanded mail balloting and early in-person voting also contributed to higher participation.
These conditions pushed voting-eligible turnout to 49.4 percent in 2018 and 46.8 percent in 2022. Those participation rates established the highest turnout levels seen in non-presidential elections since 1914.