
You can evaluate how presidential coalitions evolve by examining verified voter files rather than volatile election-night exit polls. Official state records document substantial demographic realignments across the three presidential elections between 2016 and 2024.
Donald Trump won the presidency on November 8, 2016, lost to Joe Biden in 2020, and defeated Kamala Harris on November 5, 2024. These consecutive campaigns produced marked transformations within both major political parties.
By tracking validated turnout data, you can see how racial, educational, generational, and geographic shifts restructured modern voting blocs. This analysis highlights eight measurable demographic changes that redefine contemporary American politics.
Evaluating Coalition Dynamics Across Three Consecutive Presidential Cycles
You assess national elections most accurately by reviewing certified results verified against official state voter registration files. Commercial voter files cross-referenced with local poll records confirm whether individual survey respondents actually cast ballots.
This review measures coalition shifts from the November 8, 2016 contest through the certified results of the November 5, 2024 election. It incorporates official records published by the Federal Election Commission.
In 2016, Donald Trump won 304 electoral votes while trailing in the popular vote by 2.1 percentage points. In 2024, he secured 312 electoral votes and carried the national popular vote by 1.5 percentage points.
To isolate durable structural trends from temporary political fluctuations, our editorial team tracked demographic movements across race, education, age, and geography. Each entry highlights validated voter metrics rather than speculative commentary.
Understanding these structural changes gives you actionable insight into future congressional redistricting battles and legislative priorities. The data table below summarizes the measurable demographic shifts across all three presidential elections.
| Demographic Metric | 2016 Baseline | 2020 Midpoint | 2024 Benchmark | Eight-Year Trajectory |
|---|---|---|---|---|
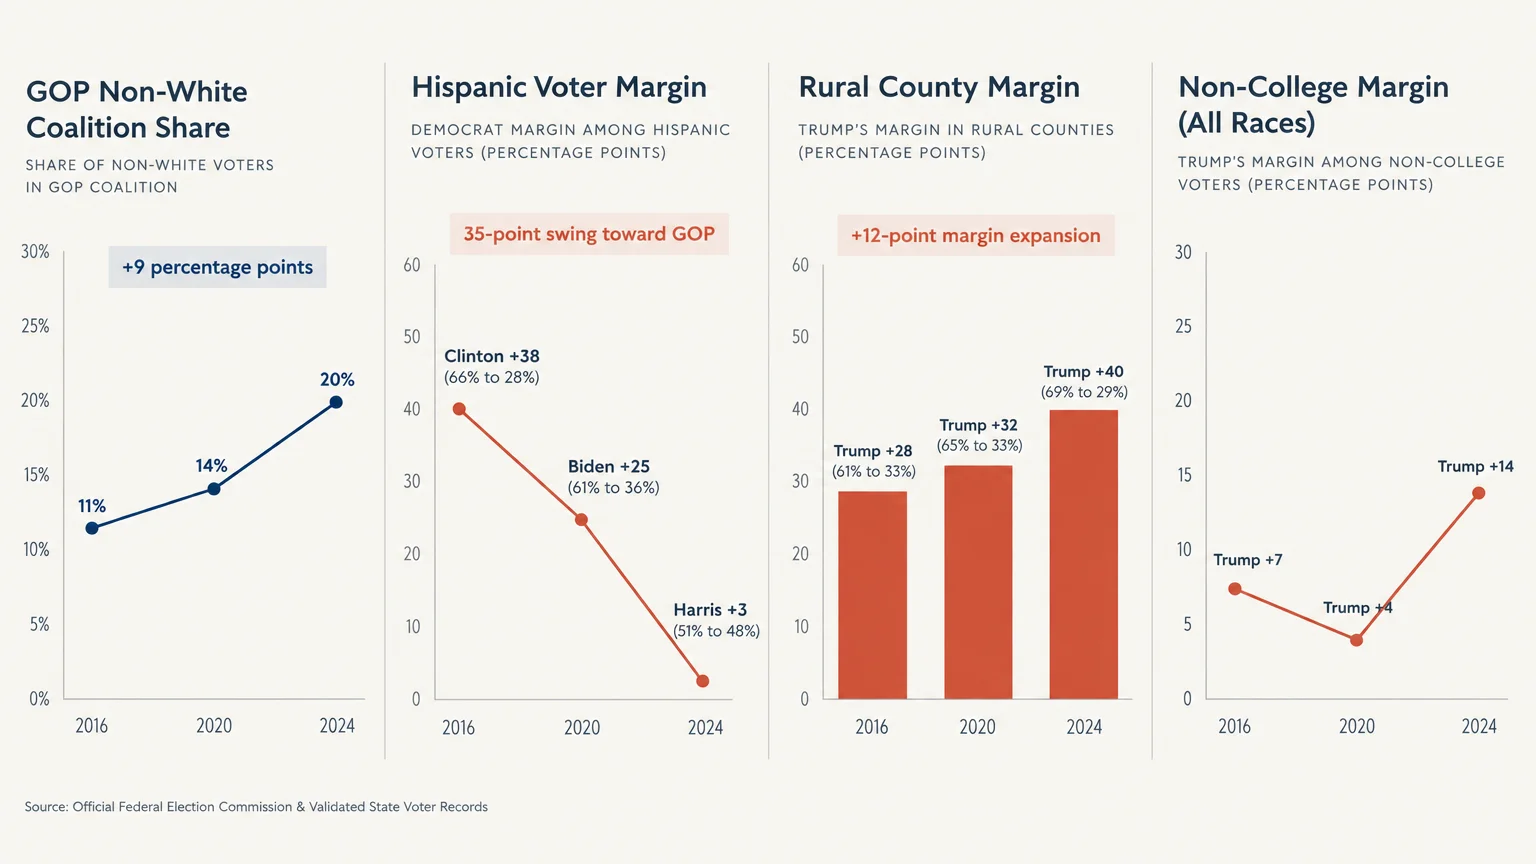
| GOP Non-White Coalition Share | 11% of Trump voters | 14% of Trump voters | 20% of Trump voters | +9 percentage points |
| Democratic White Coalition Share | 60% of Clinton voters | 61% of Biden voters | 64% of Harris voters | +4 percentage points |
| Hispanic Voter Margin | Clinton +38 (66% to 28%) | Biden +25 (61% to 36%) | Harris +3 (51% to 48%) | 35-point swing toward GOP |
| White Non-College GOP Share | 63% of Trump voters | 58% of Trump voters | 51% of Trump voters | -12 percentage points |
| Non-College Margin (All Races) | Trump +7 (50% to 43%) | Trump +4 (50% to 46%) | Trump +14 (56% to 42%) | +7-point margin expansion |
| GOP Coalition Under Age 50 | 35% of Trump voters | 36% of Trump voters | 40% of Trump voters | +5 percentage points |
| White Protestant GOP Share | 52% of Trump voters | 51% of Trump voters | 43% of Trump voters | -9 percentage points |
| Rural County Margin | Trump +28 (61% to 33%) | Trump +32 (65% to 33%) | Trump +40 (69% to 29%) | +12-point margin expansion |
Racial and Ethnic Diversification of the Republican Base
You can document a fundamental diversification of the Republican presidential coalition between the 2016 and 2024 general elections. Non-White voters steadily expanded their presence inside the party’s primary voting bloc.
On November 8, 2016, non-White voters—including Hispanic, Black, Asian, and other minority citizens—accounted for only 11 percent of Donald Trump’s total coalition. By November 5, 2024, that collective demographic share surged to 20 percent.
Conversely, the non-Hispanic White proportion of the Republican base contracted significantly over the same eight-year cycle. White voters made up 88 percent of Trump’s coalition in 2016, 86 percent in 2020, and fell to 78 percent in 2024.
You can examine the certified state returns through the National Archives Electoral College Records. This transition expanded Republican competitive margins in diverse congressional districts across southern Nevada, Arizona, and Florida.
- 2016 Baseline: Non-White voters comprised 11 percent of Donald Trump’s validated voter coalition.
- 2020 Benchmark: Non-White participation increased to 14 percent of the incumbent Republican total.
- 2024 Outcome: Non-White voters reached 20 percent, nearly doubling their baseline coalition representation.
- White Share Decline: Non-Hispanic White voters dropped from 88 percent to 78 percent of all Republican voters.
Increasing White Proportion Within the Democratic Coalition
While the Republican coalition added non-White voters, the Democratic coalition grew measurably more White across the same period. You can observe this counterintuitive trend documented in comprehensive validated voter records.
Non-Hispanic White voters made up 60 percent of Hillary Clinton’s coalition in 2016. That proportion climbed to 61 percent for Joe Biden in 2020 and reached 64 percent for Kamala Harris in the November 2024 election.
This internal demographic shift occurred even as non-Hispanic White citizens declined as a percentage of the total national electorate. Data published by the U.S. Census Bureau Voting Supplement shows White turnout fell from 74 percent in 2016 to 71 percent in 2024.
Because minority voters shifted marginally toward the Republican column, White suburban voters gained proportional influence inside the Democratic party. You must understand this dynamic when analyzing how primary campaign platforms and party messaging evolve.
- 2016 Baseline: Non-Hispanic White voters constituted 60 percent of Hillary Clinton’s supporters.
- 2020 Benchmark: Non-Hispanic White voters represented 61 percent of Joe Biden’s winning coalition.
- 2024 Outcome: Non-Hispanic White voters expanded to 64 percent of Kamala Harris’s coalition.
- Electorate Context: Total White voter participation fell nationwide from 74 percent to 71 percent.
Hispanic Voter Realignment Toward Parity
Hispanic voters demonstrated the largest partisan shift of any major demographic cohort between the 2016 and 2024 elections. You can trace this migration through official election canvasses across battleground states.
In 2016, Hillary Clinton captured 66 percent of validated Hispanic voters compared to Donald Trump’s 28 percent, creating a 38-point advantage. Joe Biden retained a reduced 25-point margin in 2020, winning 61 percent to Trump’s 36 percent.
By November 5, 2024, the contest narrowed to near parity. Kamala Harris carried Hispanic voters by just three percentage points, winning 51 percent against Donald Trump’s 48 percent.
Because of this shift, Hispanic citizens expanded from six percent of Trump’s coalition in 2016 to 10 percent in 2024. You can see how this movement altered legislative control in Florida, Texas, and Nevada.
- 2016 Margin: Democratic advantage stood at 38 percentage points (66 percent to 28 percent).
- 2020 Margin: Democratic advantage narrowed to 25 percentage points (61 percent to 36 percent).
- 2024 Margin: Democratic advantage collapsed to 3 percentage points (51 percent to 48 percent).
- GOP Composition: Hispanic voters grew from 6 percent to 10 percent of the total Republican base.
Declining Numerical Dominance of White Non-College Voters in the GOP Base
Non-college White voters have long formed the core voting bloc of the modern Republican Party. However, validated election records reveal that their proportional dominance within the Republican coalition declined steadily from 2016 through 2024.
In the November 2016 election, White voters without a four-year college degree cast 63 percent of all ballots for Donald Trump. That proportion dropped to 58 percent during the November 3, 2020 presidential contest.
By November 2024, their share of Trump’s total vote shrank to a narrow majority of 51 percent. While they remain the single largest bloc, they no longer command an overwhelming majority inside the coalition.
You should note that this 12-point decline stems from the influx of minority working-class voters rather than falling conservative turnout. This internal rebalancing forces Republican lawmakers to balance competing economic interests across broader demographics.
- 2016 Share: White non-college voters represented 63 percent of Donald Trump’s voter base.
- 2020 Share: The demographic contracted to 58 percent of the total Republican electorate.
- 2024 Share: White non-college voters dropped to 51 percent, marking a 12-point total decline.
- Coalition Impact: Non-college voters of color absorbed the expanding share of the party’s coalition.
Deepening of the Educational Attainment Divide Across All Races
College credentials have developed into the sharpest dividing line in modern American presidential voting. You can see this educational sorting accelerate across every racial background between the 2016 and 2024 campaigns.
Donald Trump won non-college voters nationwide by seven percentage points in 2016, defeating Hillary Clinton 50 percent to 43 percent. By the November 2024 election, Trump doubled his advantage to 14 percentage points, winning 56 percent to 42 percent.
At the same time, college-educated voters consolidated within the Democratic column. Voters holding a four-year degree rose from 43 percent of Hillary Clinton’s voters in 2016 to 48 percent of Kamala Harris’s coalition in 2024.
Campaign finance disclosures filed with the Federal Election Commission Receipts Database confirm that suburban professionals now supply the financial backbone of Democratic campaigns. Educational credentials have largely replaced traditional union membership as the foremost voting indicator.
- 2016 Non-College Margin: Donald Trump won non-college voters by 7 points (50 percent to 43 percent).
- 2024 Non-College Margin: Trump expanded his advantage to 14 points (56 percent to 42 percent).
- Democratic Degree Share: College-educated voters grew from 43 percent to 48 percent of the Democratic base.
- Class Realignment: Non-college voters swung toward Republicans regardless of racial classification.
Generational Realignment Toward Younger Voters in the Republican Base
Conventional political wisdom frequently portrays the Republican coalition as aging, but validated voter files tell an entirely different story. You can track a measurable youth movement inside the Republican base across three election cycles.
Voters under age 50 comprised 35 percent of Donald Trump’s total coalition in the November 2016 election. By November 5, 2024, voters under 50 expanded their share to 40 percent of his overall support.
Meanwhile, the Democratic age distribution remained completely unchanged from 2016 through 2024. Voters under age 50 represented exactly 48 percent of Hillary Clinton’s supporters in 2016 and 48 percent of Kamala Harris’s voters in 2024.
Gains among younger men largely drove this Republican expansion. After trailing among men under 50 by 10 percentage points in 2020, Trump carried that exact demographic in the certified 2024 election results.
- 2016 GOP Youth Share: Voters under 50 represented 35 percent of Donald Trump’s voter base.
- 2024 GOP Youth Share: Voters under 50 expanded to 40 percent of the Republican coalition.
- Democratic Stability: Voters under 50 remained fixed at 48 percent across both 2016 and 2024.
- Young Men Reversal: Men under 50 shifted from a 10-point Democratic advantage in 2020 to a Republican win in 2024.
Shrinking Share of White Protestants Within the Conservative Base
White Protestants historically formed the indispensable majority of Republican presidential coalitions throughout late 20th-century political history. You can now verify that their numerical supremacy ended between the 2016 and 2024 general elections.
In 2016, White Protestants—including evangelical and mainline congregations—constituted 52 percent of all Donald Trump voters, holding at 51 percent in 2020. By November 2024, their collective representation fell to 43 percent of his coalition.
Within that 2024 total, White evangelical Protestants accounted for 29 percent of Trump’s voters, while White mainline Protestants provided 15 percent. This marked the first modern Republican presidential victory without a White Protestant majority.
An influx of Hispanic Catholics and non-White Protestants compensated for this contraction, expanding to nine percent of Trump’s total coalition. You can observe how this religious diversification softens traditional denominational voting patterns in presidential politics.
- 2016 Protestant Share: White Protestants constituted 52 percent of Donald Trump’s total coalition.
- 2020 Protestant Share: The demographic maintained a 51 percent majority of the Republican base.
- 2024 Protestant Share: White Protestants declined to 43 percent (29 percent evangelical, 15 percent mainline).
- Non-White Religious Influx: Hispanic Catholics and minority Protestants rose to 9 percent of Trump’s support.
Rural Margin Expansion and the Turnout Participation Flip
Geographic divergence reached historic levels between the November 2016 contest and the November 2024 general election. You can see how rural county margins expanded to record highs while irregular voter behavior flipped dramatically.
Donald Trump won rural voters by 40 percentage points in 2024, carrying 69 percent against Kamala Harris’s 29 percent. This expanded his previous rural margins from both 2016 and the certified 2020 election.
Simultaneously, a fundamental realignment occurred among infrequent and newly registered voters across the country. In 2016 and 2020, citizens who skipped prior presidential elections favored Democrats, but in 2024, irregular voters broke decisively for Trump.
Among Hispanic voters who did not vote in 2020 but cast ballots in 2024, Trump won 60 percent to 37 percent. You can inspect historical precinct turnout data documented by the American Presidency Project to see this dynamic.
- 2024 Rural Dominance: Trump carried rural voters by 40 percentage points (69 percent to 29 percent).
- Turnout Reversal: Irregular voters backed Democrats in 2016 and 2020 but supported Republicans in 2024.
- Infrequent Hispanic Turnout: Hispanic non-voters from 2020 preferred Trump 60 percent to 37 percent in 2024.
- Geographic Sorting: Rural margins widened sufficiently to overcome Democratic urban vote totals.
How Coalition Restructuring Reshapes Modern Electoral Strategy
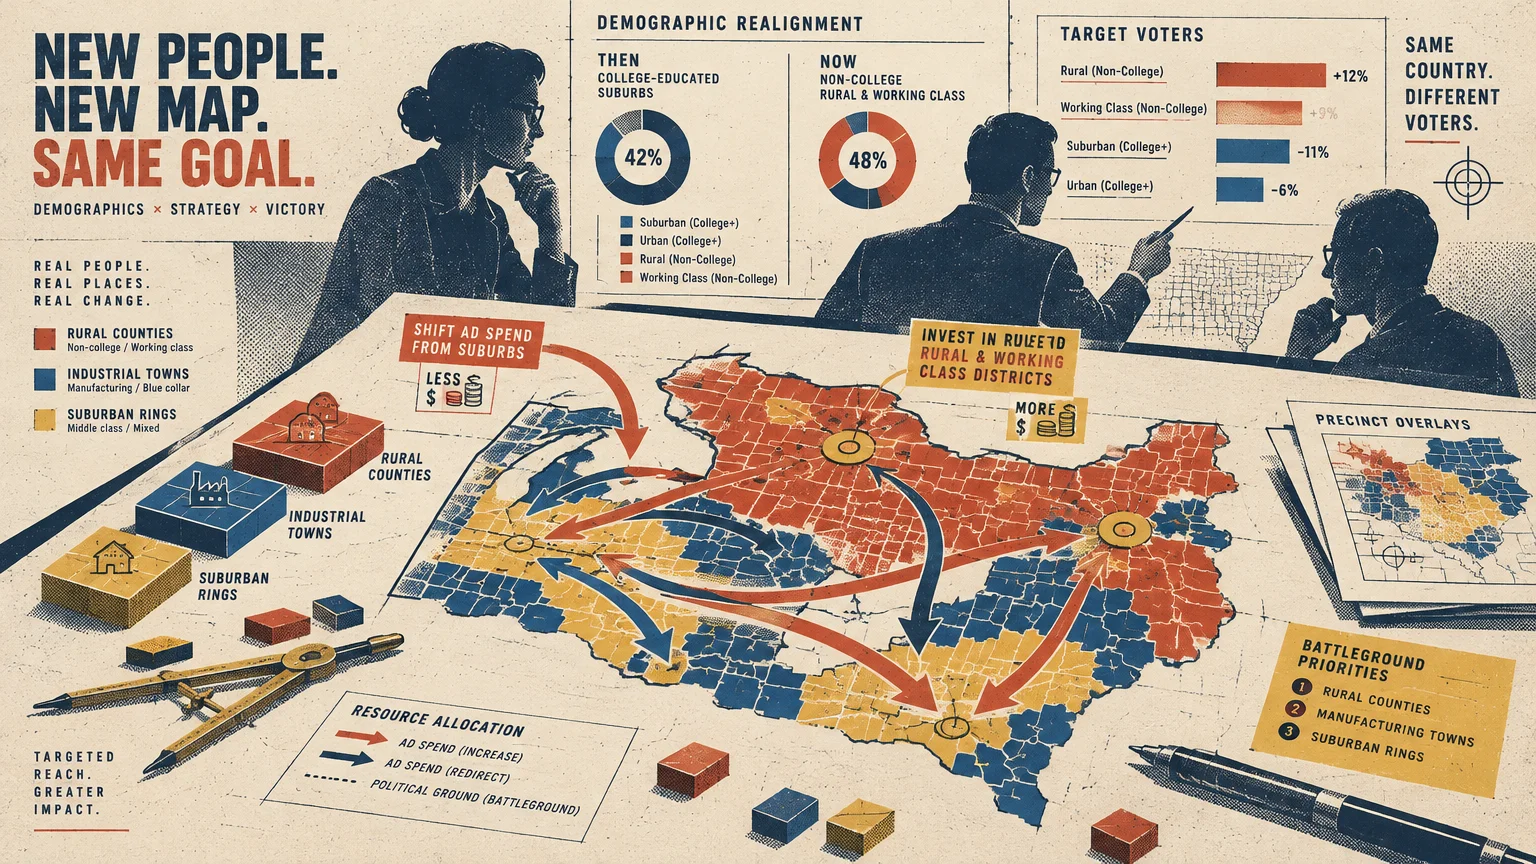
The demographic shifts between 2016 and 2024 prove that educational attainment and class alignment increasingly overshadow traditional racial voting habits. You must recognize that demographic changes no longer guarantee automatic partisan advantages for either major party.
Donald Trump built a multiracial working-class coalition that lowered the Republican Party’s reliance on non-college White voters to 51 percent. This realignment expanded Republican competitiveness across former industrial bastions and southwest border regions.
Concurrently, the Democratic Party consolidated high-income suburban communities, causing its national voter base to become 64 percent White in 2024. This concentration yields massive majorities in metropolitan districts while complicating statewide competitiveness in rural regions.
You can evaluate how geographic concentration impacts federal representation by reading reports compiled by the Congressional Research Service. Because rural voters back Republicans by 40-point margins, the median Electoral College state tilts conservative.
Party strategists must now target working-class voters regardless of race rather than assuming monolithic ethnic solidarity. Campaign playbooks that depend on rigid demographic assumptions from past decades fail to reflect contemporary voter behavior.
The shift of irregular voters toward Republicans in 2024 also introduces new volatility into future national elections. Low-propensity voters respond rapidly to economic conditions, meaning minor turnout adjustments can trigger significant shifts in congressional control.
You can expect these structural patterns to shape legislative negotiations over tax policy, trade tariffs, and entitlement spending. Coalition composition directly dictates which economic policies party leaders prioritize on Capitol Hill.
As candidates prepare for upcoming redistricting and presidential cycles through 2028, demographic fluidity will remain the defining feature of American elections. The era of static demographic voting blocs has come to an end.
Frequently Asked Questions About Coalition Demographic Shifts
Why do validated voter studies provide more reliable data than exit polls?
Election-night exit polls rely on in-person polling samples that often fail to represent early voters and mail-in balloters accurately. These initial surveys frequently skew toward specific demographic groups due to non-response bias.
Validated voter studies match survey participants directly to official state voting records after election certification. You receive verified confirmation of whether each person actually voted in the November general election.
This verification methodology eliminates respondents who falsely claim to have cast ballots during post-election interviews. Political scientists consider validated voter files the gold standard for analyzing real presidential coalitions.
Did Hispanic men drive the Republican movement among Hispanic voters?
Hispanic men shifted toward Donald Trump at higher rates, but Republican gains appeared across both men and women. Economic concerns and cultural issues motivated working-class Hispanic voters across different states.
In the 2024 election, Kamala Harris led Hispanic voters overall by just three percentage points, winning 51 percent to 48 percent. That result represents a 35-point margin collapse compared to Hillary Clinton’s 2016 performance.
You can see this shift most prominently in South Texas border counties and working-class neighborhoods in Nevada and Arizona. Hispanic voters increasingly vote based on educational attainment and economic sector rather than ethnic party alignment.
How did the education divide change suburban congressional voting?
Suburban districts with high concentrations of college graduates swung steadily toward Democratic candidates between 2016 and 2024. Voters holding bachelor’s degrees expanded to 48 percent of Kamala Harris’s overall coalition.
At the same time, working-class exurbs and non-college rural communities consolidated heavily behind Republican candidates. This educational polarization created stark partisan boundaries between inner-ring suburbs and outer-ring industrial corridors.
You should observe how this diploma divide altered fundraising patterns across battleground House races. Higher-income suburban zip codes now generate the bulk of individual itemized contributions for Democratic campaign committees.
What factors caused the Republican coalition to become younger by 2024?
The influx of younger working-class voters and men under 50 expanded the younger share of Trump’s coalition to 40 percent. Economic dissatisfaction with housing costs and inflation drove many young voters toward the challenger.
Furthermore, alternative media platforms and digital campaign outreach bypassed traditional legacy television networks to reach younger men directly. Trump won men under 50 in 2024 after losing them by 10 points in 2020.
Meanwhile, Democratic support among voters under age 50 held flat at exactly 48 percent across both the 2016 and 2024 cycles. This static performance prevented Democrats from maintaining their historical generational advantage.